Learning the COVID-19 Severity Based on Colour Codes
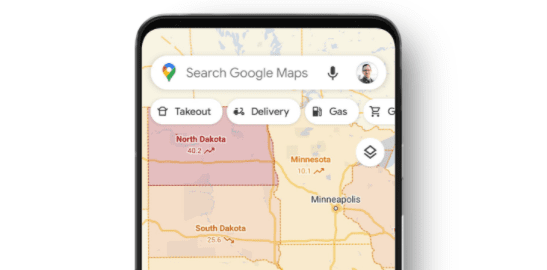
Google Maps has been a major platform in helping people amidst the current pandemic. The service has been tuned like others to help citizens in knowing about their surroundings much. This by letting businesses update their working hours easily and highlighting the medical centers across the regions. While these have been helpful so far, the maker is pushing yet another update to make it more useful. As we’ve seen earlier from Jane Manchun Wong, Google introduced a new layer for its Maps platform called COVID-19 Info. Activating this feature from Menu Layers would refresh the maps with different color codes. These color codes (as shown above) are based on the number of cases recorded in that region. Users can see a number: the total number of COVID-19 cases per 100,000 recorded in that area, along with a trend arrow showing falling or rising trend of circumstances. This information can be helpful to learn about the severity of COVID-19 in that region. Google updates these numbers as per the data provided by various public resources like the New York Times, John Hopkins University, etc., which procure data from concerned regional government agencies. While Google neglects the PC version of Maps, it says this new layer is available for both Android and iOS apps and will rolling to users starting this week.